

Improving Machine Learning Models for Autonomous Vehicles
Note: Woven Planet became Woven by Toyota on April 1, 2023.
Note: This blog was originally published on January 27, 2022 by Level 5, which is now part of Woven Planet. This post was updated on December 13, 2022.
By Alborz Alavian, Senior Software Engineer; Wentian Cui, Senior Software Engineer; and Linda Wang, Software Engineer
The challenge with current model evaluation
In any machine learning (ML) project, examining and improving models is critical to achieving a goal. At Woven Planet our goal is safe automated driving. This is one of the biggest challenges being tackled using ML, and we need to be able to inspect and debug our models with precision and granularity.
Machine learning researchers and practitioners usually rely on metrics averaged over all data points to compare ML models and select the best among them. For example, in computer vision, “mean average precision” (mAP) is heavily used to summarize and compare multi-class detection models. But average metrics like mAP mainly fit the purpose of improving the model architecture in an academic setting where performance trade-offs on individual data samples are not a major concern. In the autonomous vehicle (AV) industry, relying only on these kinds of metrics is insufficient. We need to be able to:
Understand corner cases because they’re crucial to safely deploying AV models.
Derive actionable insights by studying failure cases and identifying patterns.
Compare inference results side-by-side to analyze improvements and regressions.
We can rethink this!
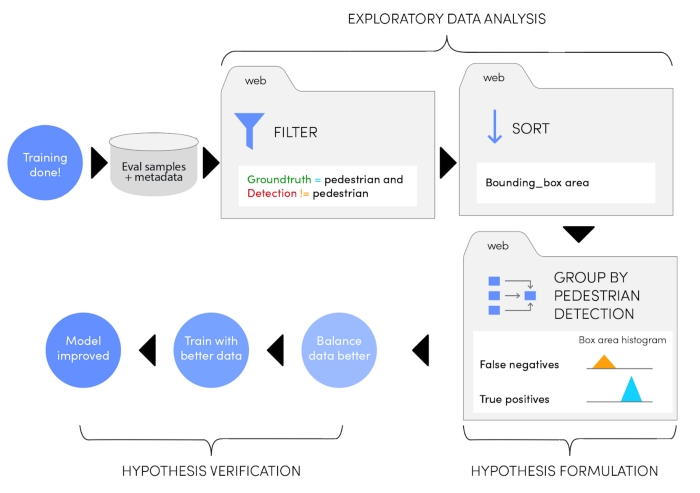
Our model introspection framework allows our ML engineers to carefully debug their models. This framework makes it possible to log all the desired metrics and metadata for each sample in the evaluation dataset. In less than a minute, we can sort or filter the entire set using any desired combinations of the logged metadata.
We now can understand corner cases better by sorting hundreds of thousands of samples — and exploring their corresponding metrics, ground-truth, and model-prediction visualizations — all via a web interface (we typically use interactive Weight and Biases (W&B) tables).
Our framework enables us to find large-scale, data-driven insights on every trained model by utilizing distributed W&B tables. This allows us to interactively combine, filter or group different metrics until an actionable pattern is found. For example, as we inspected our recent object detection and classification model, we used the web interface to filter for pedestrian false negatives, looked at a few examples, and ran a few quick one-minute queries to explore all samples. When we sorted by ground-truth bounding box area, we discovered that misdetections are more severe for smaller bounding boxes. Then, we compared bounding box area distribution for false negatives versus correctly classified pedestrians. We saw a significant imbalance where it was clear that our next step would be data balancing (illustrated in the figure below).
Once we observe a pattern, it’s easy to attach a dynamic snapshot of these interactions to a sharable interactive report. Team members can apply the same explorations on top of another model’s output simply by changing the model name, all instantaneously in the web browser. Even better, it’s easy to turn summaries of these explorations into trackable metrics for all models.
How to scale and productionalize
In order for our model introspection framework to be useful beyond a few experiments, it needs to be productionalized and scalable. Here is how we addressed both requirements:
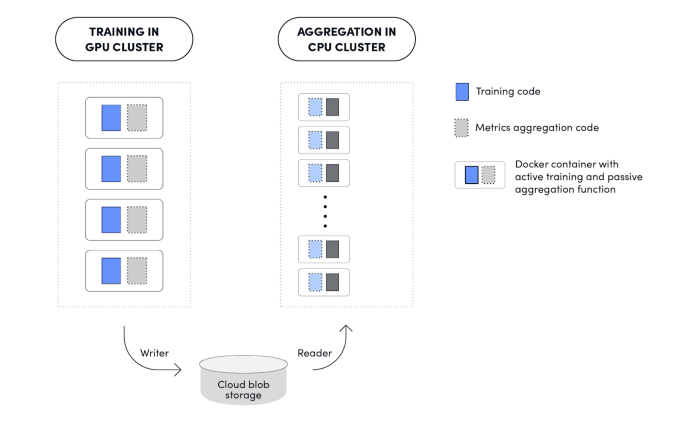
We developed the ability to record sample data for any intermediate steps during training in the GPU cluster.
We developed the ability to perform post-process statistical aggregations on the recorded samples and publish all these samples into a visualization tool. (Note that the CPU-intensive aggregation logic will be offloaded to the CPU cluster.)
Data collection
The framework provides a simple API for users to record all samples with additional metadata and model output such as tensors, images, and videos. These intermediate data samples can be either part of the ground-truth or generated by model prediction. The data will persist and will transparently upload to the cloud in the background. The framework has these data properties:
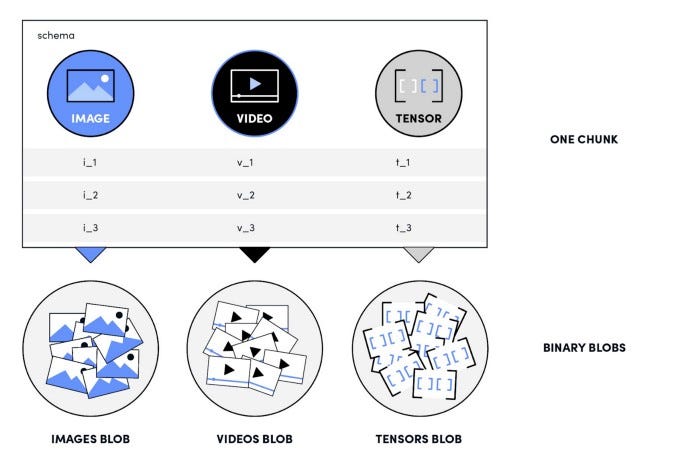
Integrity. The framework offers strong data integrity by enforcing schema to the data format. Considering the fluidity of AV data, this helps maintain consistent data between different experiments and models.
Scalability. Samples are gathered in chunks that support columnar data-access patterns and random access. This is critical to make both reading and writing efficient. Because there can be millions of tiny samples (such as tensors), as well as larger ones (like images and video), it’s critical that reading and writing is efficient. The persister splits large binary columns, such as images and video, into separated binary blobs. That ensures the large binary contents won’t interfere with our access to the tiny samples enabling us to read sample metrics in orders of magnitude less time.
Durability. The gathered chunks or blobs are uploaded to the cloud in the background. The framework hides the details of the storage media by providing a thin abstraction layer for writing, retrieving and reading the samples.
Sample writer interface
To record interesting samples, there are two main API calls: write_sample and commit. For each sample, the user calls write_sample to publish the sample to local storage. This call is parallelizable, which means that the data can be published concurrently from multiple processes. Once all samples are written, making a commit call reorganizes the recorded samples. The reorganized samples then upload to the cloud so the data can be accessible from anywhere.
Sample reader interface
Because the data is accessible from anywhere, the logged samples can be retrieved by providing the dataset name and version to the API, as shown below. Once the logged samples are retrieved, they can be filtered to expose the aggregate samples to the desired datasets.
dataset = S3Dataset("dataset_name", "0.0.1")
sample = self.dataset[idx]  # get sample
sample_video = sample["video"] # get the scene of predicted and target trajectories
reading_sample.py hosted with ❤ by GitHub
Scaling metrics aggregation
Users have to claim a fixed set of GPU nodes for a training task and thus the number of GPU/CPU cores are predefined. It is impossible to scale metrics aggregation in a training environment. Processing of millions of rows of sample data may require a lot more CPU resources than the training environment can provide.
Though training/data collection and metrics aggregation execute in different environments, we provide a seamless experience so all the development and testing happen in the same repo with the same interface. The framework makes handling sample data, offloading, and launching the metrics aggregation transparent to users. By doing so, we can keep our training cluster efficient while being able to process and analyze large amounts of data in the CPU cluster. Other limitations for conducting metrics aggregation in GPU cluster are:
Restrictive data format. In the training environment, data is synced among nodes as tensors. This makes it less efficient and flexible for CPU-intensive compute logic.
Expensive GPU cycles. Offloading metrics aggregation improves the efficiency of the GPU cluster and thus reduces costs.
Here’s how it works:
At the end of an ML training task, the framework triggers the metrics aggregation job in the CPU cluster by only invoking the specific entrypoint. End users will see the same image and programming paradigm when developing the training and metrics aggregation logics.
Users can implement the metrics aggregation logic, by leveraging the following set of APIs. They can specify the desired number of CPU workers, without worrying about where/when/how the logic will be executed.
num_workers specifies the number of workers to distribute the aggregation tasks.
run_metric_worker contains the main logic for metrics aggregation. Users can pull data via the sample reader API, as mentioned in the above session.
commit_metrics will be invoked by the framework, after completing all the aggregation tasks. It will be called only once to finally commit the data or notify about the status of the current job.
Case Study: Improving ML Planner with safe stopping
Our data-driven ML Planner learns to predict the next few seconds of AV trajectory using the current frame and past historical information, instead of using hand-tuned heuristics. When we were evaluating the model, our overall metrics indicated that the planner had a lot of front collisions. By using model introspection, we were able to see that many of the front collisions were due to the AV failing to stop behind the lead vehicle.
Unaware of which cases were causing the front collisions, we logged thousands of scenes, along with metadata about each scene. The three main types of metadata are scene visualization, scene category, (e.g., stopping in front of a lead vehicle) and model performance according to the evaluator (e.g., number of failed frames for front collision).
Since we knew the planner was struggling with front collisions, we sorted the table by scenes that had the most failed front collision frames. We noticed that there was a lead vehicle in many of the scenes, which indicated that the planner was having a difficult time stopping with a lead vehicle.
Sorting the table by scenes that had the most failed front collision frames
Armed with that insight, we considered the cause. One hypothesis was that we don’t have a sufficient amount of examples that teach the model to stop behind a lead vehicle. So we curated more scenes where the ego vehicle slows down with a lead vehicle. Then, after we trained a model with this additional data and used model introspection to check the results, we found we were able to reduce front collisions by 3x by adding more scenes for the specific scenario.
Comparing the baseline model with the collisions and the new model. The new model significantly reduced the number of front collisions.
Left: the performance of the baseline model, where the AV (pink) collides with a lead vehicle (purple). Right: the improvement of the new model. The AV (pink) stops with room behind a lead vehicle (purple).
The previous process was laborious and time-consuming; to find scenes prone to collisions, we had to manually look through a limited amount of randomly logged data until we would find an interesting case. And, we would have to curate general scenes to improve collision metrics instead of finding germane scenes.
By using model introspection, we were able to sort through all the inference samples in under a minute and quickly identify cases where the failures were occurring. Interestingly, it takes only a couple more minutes for the framework to gather and publish the data to the cloud.
The use of model introspection not only increased our ML engineering productivity, but also allows us to easily and efficiently identify failure cases. Since the framework is generalizable and scalable, we could apply it to different ML models and datasets across our organization.
Conclusion
We developed a model introspection framework that enables team members across our organization, including machine learning engineers, to quickly understand and debug their learned models. This framework scales to all the models trained daily across our team with very efficient resource consumption and a large degree of flexibility to understand new problems with trained models. We achieved this with architecture that is very entangled with our distributed training and evaluation setting.
Join us!
We’re looking for talented engineers to help us on this journey. If you’d like to join us, we’re hiring!